Sinology: Why China? A Macro Perspective
By Andy Rothman
Introduction: China drives global growth
China drives global economic growth. Do you have adequate exposure to China in your portfolio?
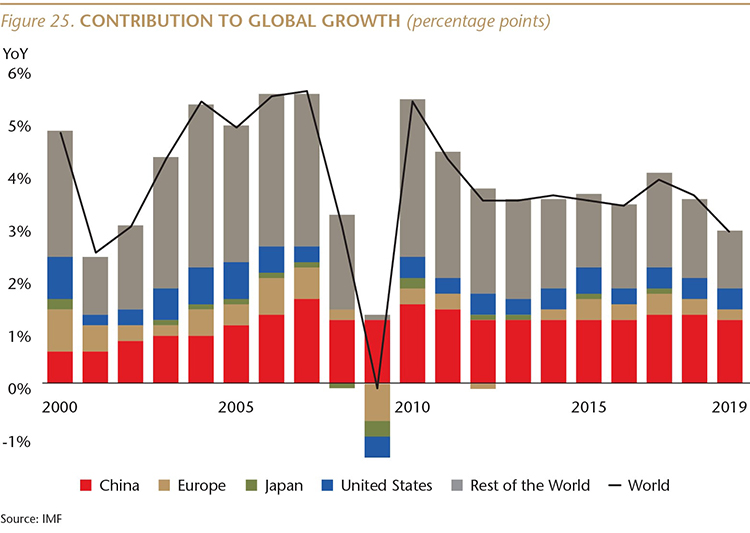
In the 10 years through 2019, China, on average, accounted for about one-third of global economic growth, larger than the combined share of global growth from the U.S., Europe and Japan.
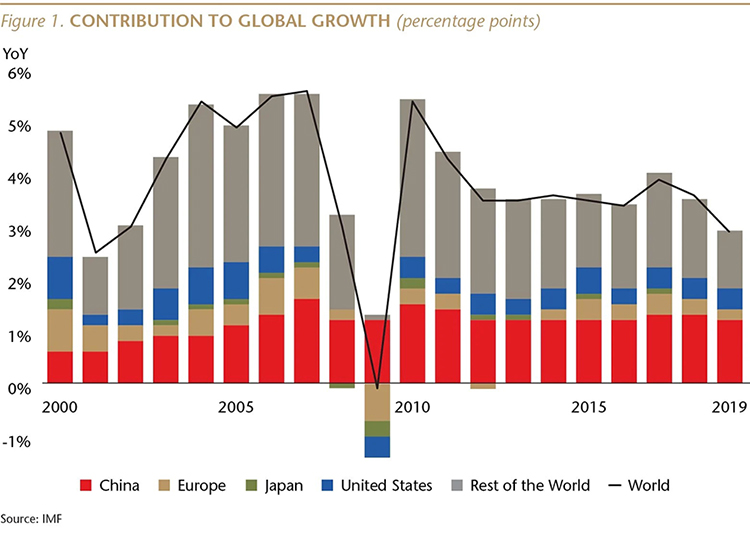
In 2020, China probably accounted for almost all of the world’s economic growth, as was the case during the global financial crisis. But that will likely return to “only” a one-third contribution this year.
At the same time, most investors have little, direct exposure to this driver of global growth. We estimate that in the average American investor’s portfolio, China accounts for only about 3% of holdings.
In this issue of Sinology, we provide a macro perspective for thinking about whether an investor’s portfolio has enough exposure to China. We bust a few misconceptions—for example, private (not state-owned) companies are the engine of China’s economy—and explain how the country has become the world’s best consumer story. We assess the sustainability of China’s growth trajectory, and examine the key risks, from real estate to shadow banking and demographics.
Rebalancing for sustainable growth
One of the most important things for investors to understand is that the fundamental structure of the Chinese economy has changed in two ways.
First, the economy is in the midst of a rebalancing away from dependence on manufacturing to an economy which, like developed economies, is driven by services and consumption.
Last year was the ninth consecutive year in which the services and consumption (tertiary) part of China’s GDP was larger than the manufacturing and construction (secondary) part, as rebalancing continued despite the pandemic.
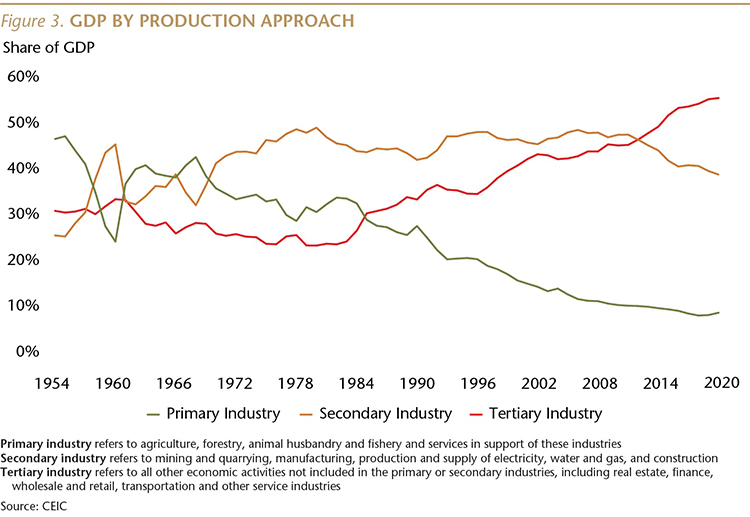
Consumption does not yet play as large a role in China’s economy as in most developed countries (consumption is about 56% of China’s GDP, compared to an OECD average of 73%), but this transformation towards a domestic demand-driven economy is well under way and will continue, offering opportunities to investors.
The Chinese government spent a couple of decades focused on building out public infrastructure—everything from roads and bridges to power generation and distribution, as well as high-speed rail lines to connect the more than 150 cities with populations over one million. This, along with the rise of entrepreneurial, privately owned firms that we describe in the next section, laid the foundation for a consumer-driven economy. In recent years, this consumer story has thrived, and it is likely to become an increasingly important driver in the coming decades.
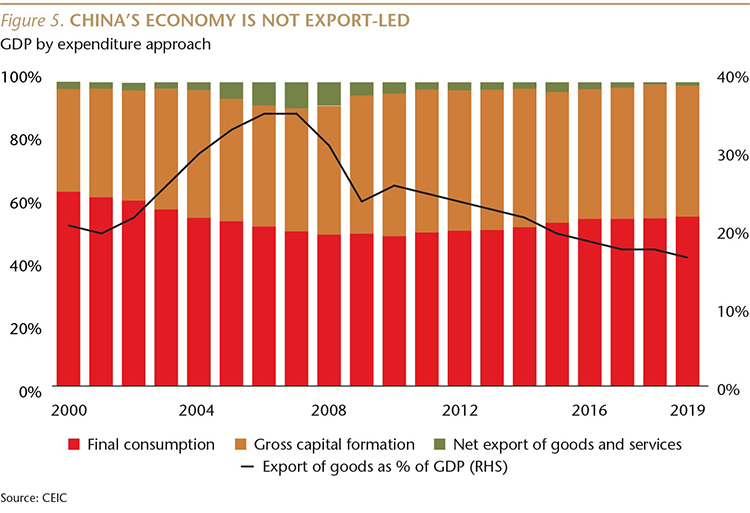
It is also worth noting that as domestic consumption has become more important, the contribution of exports has declined. During the five years from 2015 to 2019, net exports (the value of a country's exports minus its imports) contributed, on average, zero to China's GDP growth. This statistic highlights a couple of important points for investors. First, the declining importance of exports in a rapidly growing economy reflects the rising importance of domestic demand. Second, it means China’s economic health is less dependent on the vibrancy of other markets, and is less susceptible to political tensions with other nations.
Here’s another way to look at the rise of domestic demand and the declining significance of exports: In 2019, China accounted for about 16% of global GDP, but 13% of global goods exports.
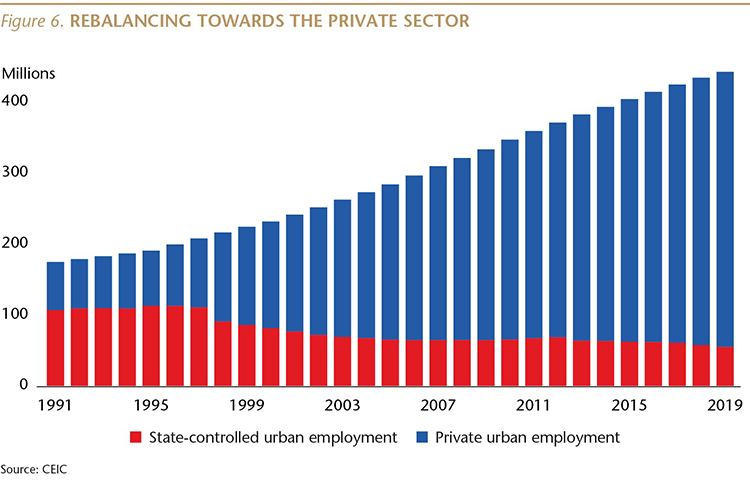
The second important structural shift is that Chinese companies have become entrepreneurial.
When I first worked in China, in 1984, there were no private companies—everyone worked for the state. You couldn’t even find a privately run restaurant. Today, almost 90% of urban employment is in small, privately owned, entrepreneurial firms. With the state-sector continuing to shrink, all of the net, new job creation today comes from private companies.
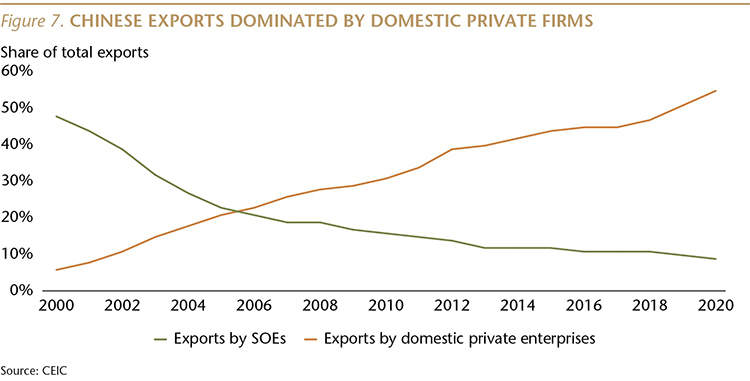
Another way to visualize the rise of private companies is through their share of China’s exports. Just 20 years ago, domestic private companies accounted for only about 5% of total exports, while in 2020 that share rose to more than 50%. In contrast, over that period of time, the share of exports from state-owned enterprises (SOEs) fell from 47% to less than 10%. (The balance of exports are produced largely by foreign-owned firms.) Even though exports play a smaller role in China’s economic growth, China remains the world’s largest goods exporter, so the dominant share held by private firms is a useful metric for understanding the key role entrepreneurs now play in the country.
The extent of private ownership in China may surprise many investors. A recent study published in the U.S. by the National Bureau of Economic Research found that in 2019, individuals owned 69% of registered capital of all Chinese companies, up from a 52% share in 2000.
With private firms driving job creation and innovation in China, they are the focus of my investment team colleagues at Matthews Asia. Among the top 10 holdings of our China Strategy, as of the end of 2020, only two were state-owned (both financials), and among the top 10 holdings of our China Small Companies Strategy, none were state-owned. Among the top 10 holdings of our China Dividend Strategy, four were state-owned, as of the end of 2020.
World’s best consumer story
China remains the world’s best consumer story.
This story is built on a foundation of the two structural changes I have just described—macro rebalancing to consumption and services from manufacturing and construction, and the rise of the private sector—and has been sustained by bringing COVID-19 under control.
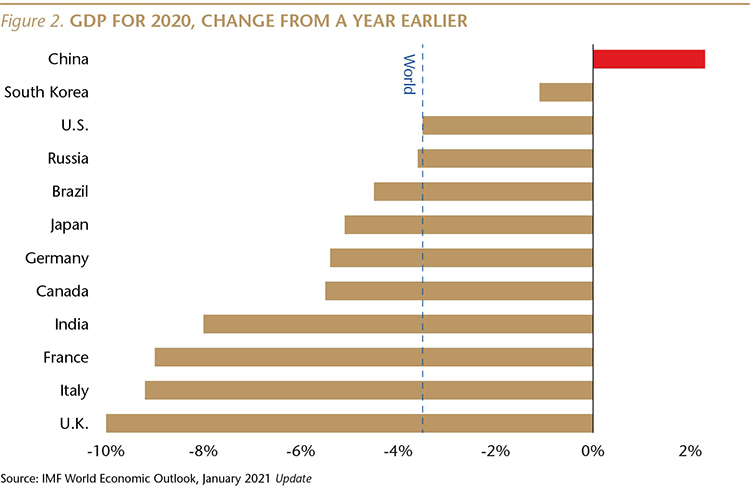
While the Chinese authorities continue to battle relatively small COVID outbreaks, a year after an initial cover-up and nearly 5,000 deaths, China is one of a handful of countries that have controlled the virus well enough to get economic growth back on track. Through March 5, China had experienced only 3 COVID deaths per million population, compared to 1,605 deaths per million in the U.S. and 1,821 in the UK.
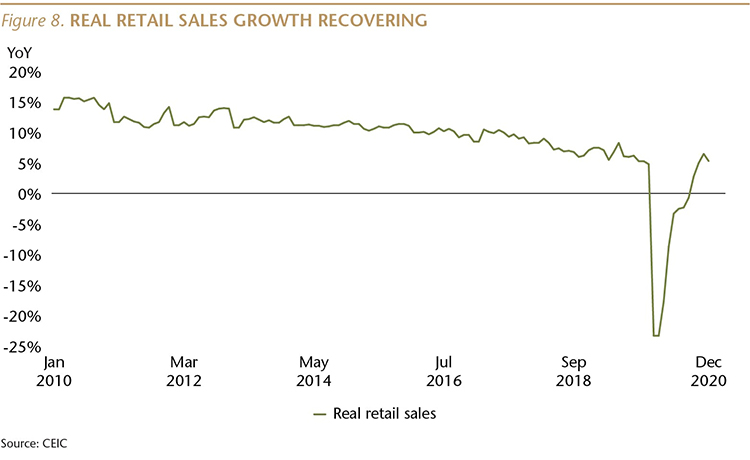
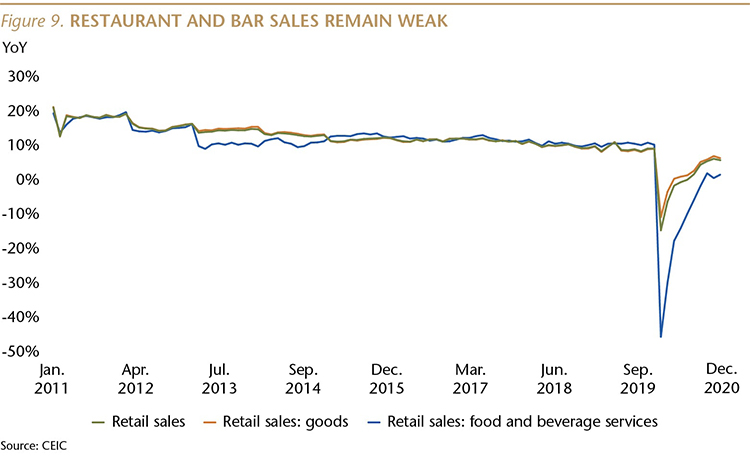
Consumption was relatively weak early in 2020, when China was largely locked down to fight COVID, but in the fourth quarter—when COVID was largely under control—there was a significant rebound, and the 5.2% YoY growth rate of real (inflation-adjusted) retail sales in 4Q20 was actually a bit faster than the 4.7% pace of 4Q19.
With COVID fears lingering, however, spending in restaurants and bars remains weak.
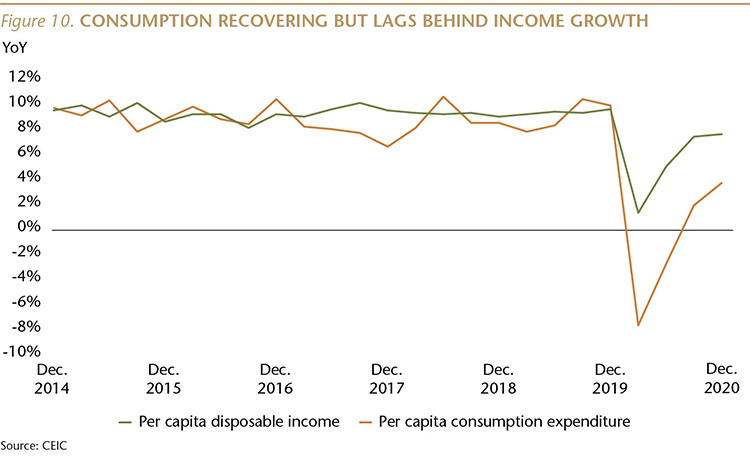
On a broader basis, the recovery in the growth rate of household consumption has lagged behind the recovery in household income growth, reflecting the continuing impact of COVID, especially on services. In 4Q20, per capita disposable income rose 7.1% YoY, compared to a 9.1% pace a year earlier.
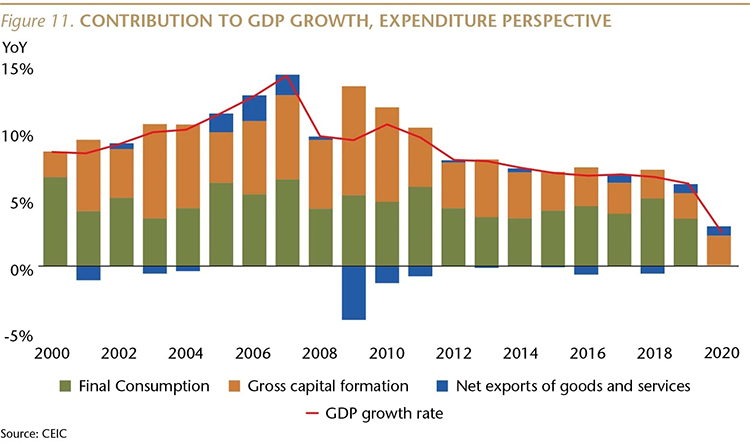
As a result, as illustrated by Figure 11, final consumption contributed negatively to China’s GDP growth for the full year of 2020. That data point has received a lot of attention, but obscures a trend which is more important for investors thinking about 2021: the drag on growth last year from consumption came during the first two quarters, when COVID was at its peak in China. During the third and fourth quarters, with fewer worries about the virus, consumption contributed positively to GDP growth.
One sign that consumers are increasingly comfortable gathering indoors was that movie ticket sales hit an all-time monthly high in February, despite COVID-restrictions that limited occupancy of theaters.
With vaccines being rolled out across China, and much of the rest of the world, the consumer recovery is likely to accelerate in the coming quarters.
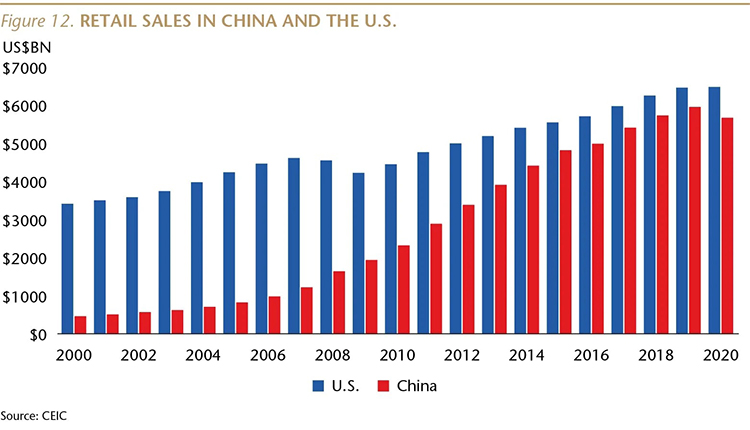
From a longer-term perspective, the continuing rise of the Chinese consumer story is clear. In 2019, retail spending in China, converted to dollars, was equal to 92% of retail sales in the U.S., up from 46% a decade earlier.
In 2020, during the pandemic, that ratio declined as the Chinese government maintained stricter social distancing requirements and provided less assistance to its households than was offered by the U.S. government to American families. As a result, retail sales in the U.S. rose 0.3% YoY in 2020, while in China retail spending fell 3.9%, and China’s retail sales equaled 88% of that in the U.S. With COVID increasingly under control and wages beginning to rise in China, that ratio is likely to resume its rise in 2021.
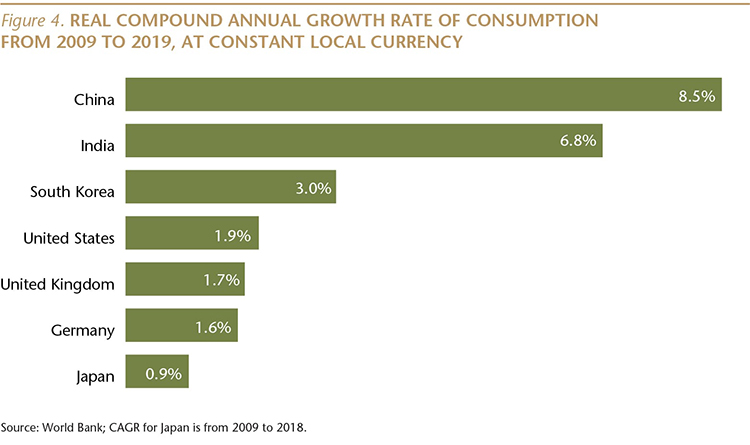
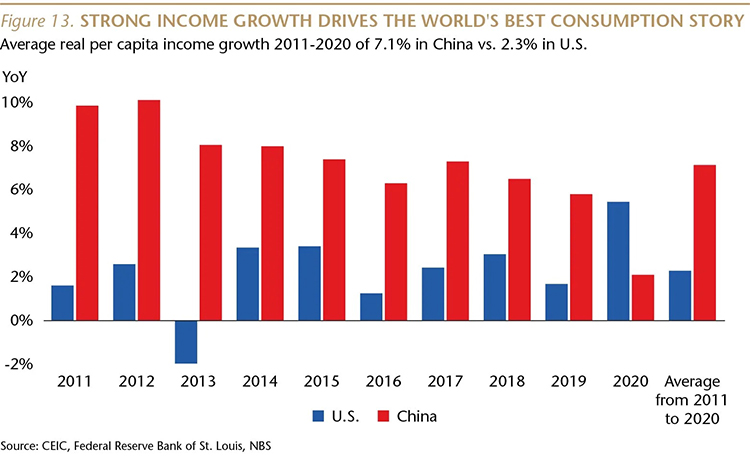
Strong consumer spending in China has been fueled by dramatic income growth. Over the 10 years through 2019, inflation-adjusted income rose at an average annual pace of 7.9% in China, compared to 1.9% in the U.S. and 0.7% in the UK. In 2020, during the pandemic, the per capita disposable income of Chinese households rose 2.1% YoY in real terms, vs. a 5.5% rise in the U.S. (Income growth in the U.S. was attributable in part to a large increase in government benefit transfers to households last year, which accounted for 21.4% of personal income, compared to 16.6% in 2019. In China, net transfer revenue accounted for 19.2% of per capita income last year, barely changed from the 18.5% share in 2019.)
I expect China’s strong consumer story to remain resilient in the coming years. Income growth is likely to accelerate as the impact of COVID recedes further. The year-over-year growth rate is likely to slow gradually, but should remain much faster than in other large markets.
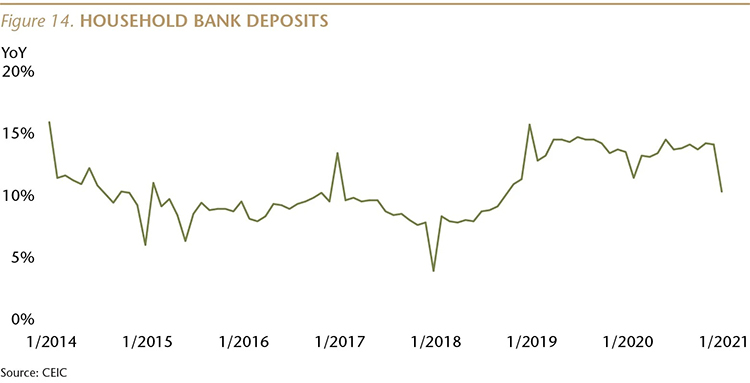
And a high propensity to save also backstops strong spending. Household bank deposits have been rising at a double-digit YoY pace since late 2018, and as of 2020, the savings rate was 38% for urban families and 20% for rural.
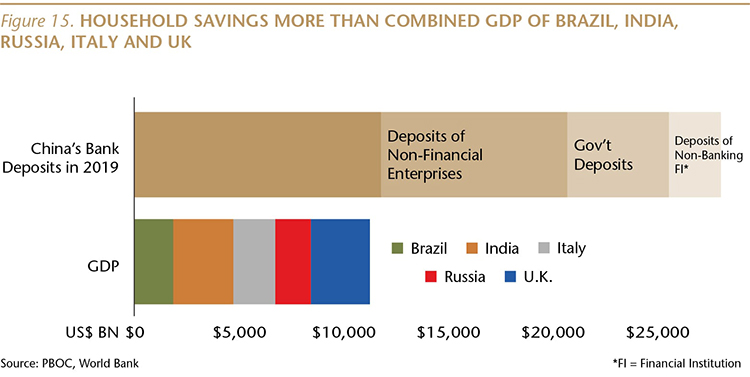
In 2019, household bank deposits in China, converted to dollars, were larger than the combined GDPs of the UK, Brazil, India, Russia and Italy.
Understanding risks
Investing in China is not, of course, without risks. It is, however, important to understand these risks, and to put them into context. In this section, we explore some of the China macro risks.
Demographics Risk
Let's start with a bit of historical background. Rapid population growth after World War II led to a global focus on birth control. One extreme response was India’s forced sterilization campaign between 1975 and 1976 when more than 8 million sterilizations were performed. In 1980, China began enforcing its “one-child policy,” which three prominent Chinese demographers, writing recently in a U.S. academic journal, called “the most extreme example of state intervention in human reproduction in the modern era. . .that has forcefully altered family and kinship for many Chinese.”
In 2013, China’s Communist Party announced a significant relaxation of the one-child policy, including dismantling the bureaucracy that was responsible for enforcing that policy.
The most significant aspect of this move was political, as it represented the Party’s decision to withdraw from its citizens’ bedrooms. Restoring this element of personal freedom was intended to help rebuild people’s trust in the Party.
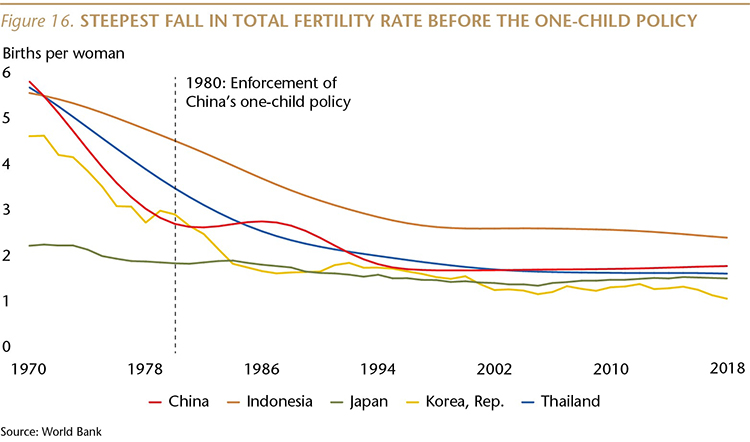
But, contrary to conventional wisdom, ending the one-child policy was not designed to alter the longer-term trend toward a lower fertility rate. It is important to recognize that the steepest fall in China’s total fertility rate (the average number of live births per woman) actually came before enforcement of the one-child policy began in 1980. The fertility rate dropped by more than half, from 5.7 to 2.6, between 1970 and 1980, influenced by rising urbanization and falling infant mortality rates.
In 2013, when the policy was relaxed, China’s fertility rate was 1.65. Today, China’s fertility rate is about 1.69, and it may drop even lower in the future, as the pressures of modern life lead Chinese couples to have smaller families. Note that the fertility rates in South Korea, Thailand and Japan are all lower than in China.
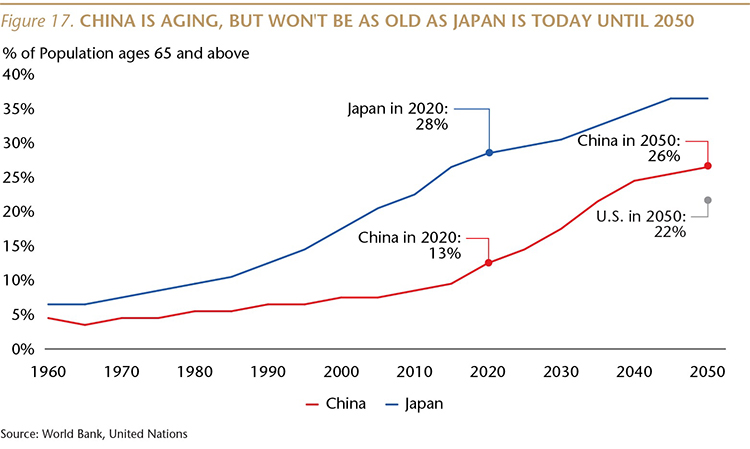
China is aging rapidly, but context is important. Today, about 13% China’s population is 65 or older, compared to 28% of Japan’s population (and 16% in the U.S. and 19% in the UK). China won’t be roughly as old as Japan is today until 2050, when it is projected to have 26% of its population over 65. (At that time, 22% of the U.S. population and 25% of the UK are forecast to be 65 or older.)
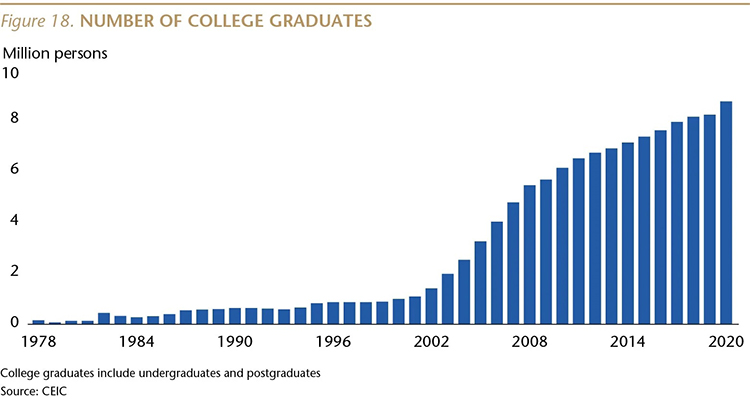
The Chinese government has been taking several steps designed to mitigate the economic impact of an aging population. Perhaps the most important step has been a focus on raising education levels, to prepare its workforce for higher value-added jobs. The annual number of graduates with college and advanced degrees has risen to 8.7 million in 2020, up from 1 million in 2000.
Significant education challenges remain, however, particularly in rural China. For example, Stanford University’s Scott Rozelle, in his recent book, Invisible China, reports “studies consistently show a large and persistent gap in learning between children in China’s rural and urban schools.” He notes that “a third of rural sixth graders need glasses but don’t have them,” and in some rural communities, “on average, more than 50% of these children were shown to have delays in cognition, language or social-emotional skills.”
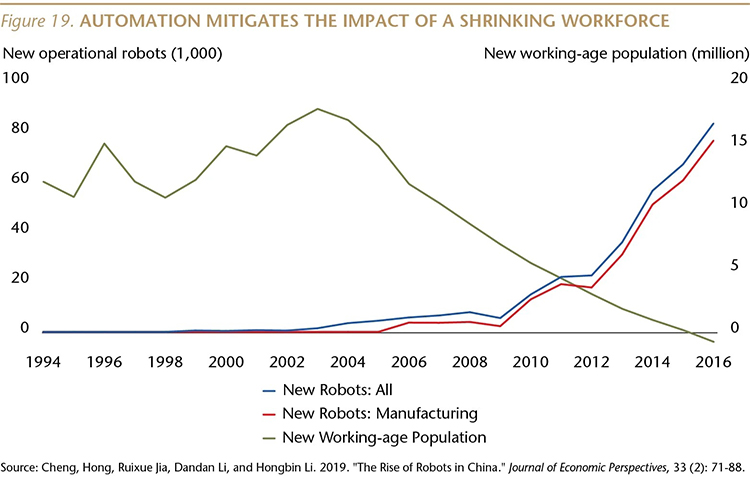
A second important step has been government policies to encourage automation as a way to compensate for a gradually shrinking workforce. Rising wages have also motivated manufacturers to automate, and, as a result, China is now the world’s largest user of industrial robots.
"In 2016, sales of industrial robots in the country reached 87,000 units, accounting for around 30% of the global market," according to a study published in 2019 by the London School of Economics and the Journal of Economic Perspectives. “To put this number in perspective, robot sales in all of Europe and the Americas in 2016 reached 97,300 units (according to data from the International Federation of Robotics). In addition, between 2005 and 2016, the operational stock of industrial robots in China increased at an annual average rate of 38%.”
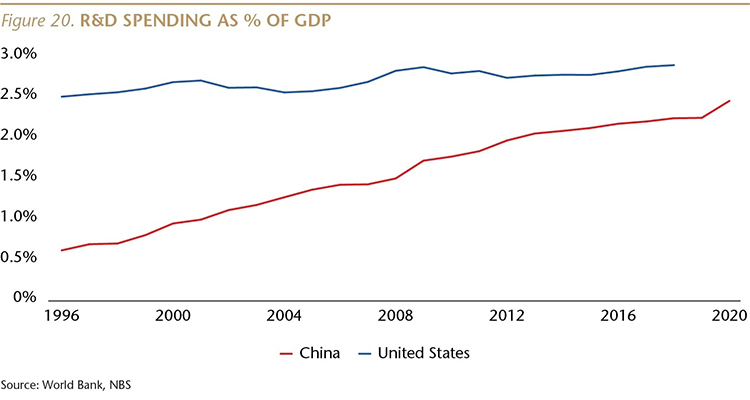
The third step has been a series of government policies intended to stimulate innovation, to propel Chinese firms up the value chain. Research and development spending as a share of GDP has risen from 0.9% in 2000 to 2.4% in 2020. Investors already familiar with China are aware of the many innovative, publicly listed companies in sectors ranging from on-line services, to biotech and electronics.
A fourth step which is likely to come in the near future will be an increase in China’s official retirement age, which is, at 50 - 55 for women and 60 for men, one of the lowest in the world. Raising this to the OECD average of 65, for both men and women, could boost the size of the workforce by 27 million annually. In contrast, from 2015 to 2019, the average annual net increase in urban employment was 10 million.
Financial Sector Risks
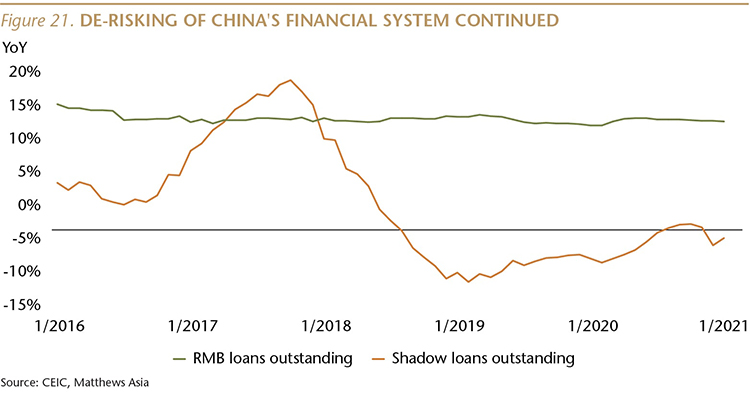
Some readers may recall that a decade ago, one of the key China worries was about wealth management products. This story retreated (and then disappeared) from the headlines as regulators took steps to manage risks. A similar process is underway today, with a focus on off-balance-sheet (shadow) lending.
Despite a sharp economic downturn during the worst of the pandemic in the first half of last year, China’s regulators maintained policies designed to de-risk the financial system, and January 2021 was the 32nd consecutive month in which the year-over-year change in shadow lending declined.
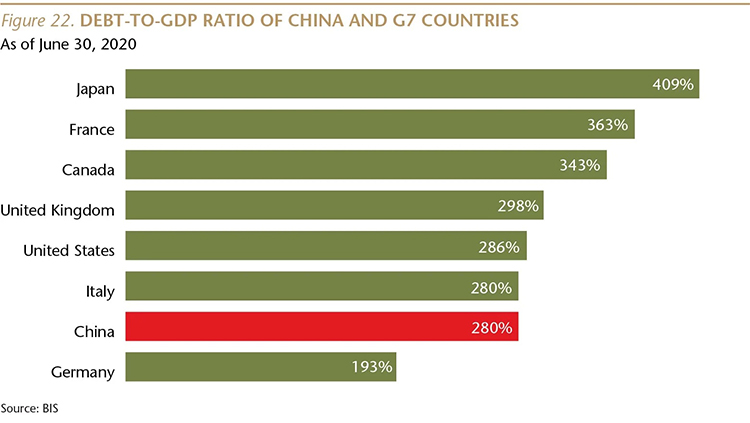
Debt Problems
China's debt problem is serious, but the risk of a hard landing or banking crisis is, in my view, low. The reason is that the potential bad debts are corporate, not household, debts and were made at the direction of the state—by state-controlled banks to state-owned enterprises. This provides the state with the ability to manage the timing and pace of recognition of nonperforming loans. It is also important to note that the majority of potential hidden bad debts are held by state-owned firms, while the leverage of the privately owned companies that employ the majority of the workforce and account for the majority of economic growth isn't high. Additional positive factors are that China's banking system is very liquid, and that the process of dealing with bad debts has begun.
Cleaning up China's debt problem will be expensive, but will not likely lead to the dramatic hard landing or banking crisis scenarios that make for a sexier media story.
Residential Property Market
China's housing market is not generating the kind of financial system risks that developed in the U.S. during the decade prior to the Global Financial Crisis, in part because China’s regulators have learned from our mistakes. In fact, because homebuyers are required to use a lot of cash and because banks have not been permitted to make irresponsible loans, mortgages may be among the safest of bank assets in China.
Chinese homebuyers who use a mortgage must put down at least 20% cash for a primary residence (and much more for an investment property), in sharp contrast to the 2% median cash down payment in the U.S. in 2006.
It is also worth noting that Chinese banks have not been permitted to engage in the “financial engineering” that precipitated the U.S. crisis. For example, nearly one-quarter of all mortgages made in the first half of 2005 in the U.S. were interest-only loans. Those do not exist in China.
There is very little mortgage securitization in China, and most banks hold mortgages through maturity, so they have a clear incentive to avoid lending to risky borrowers.
And the government has been continually fine-tuning its policies to limit property market speculation and promote the construction of lower-cost housing. Recent regulations have also limited bank exposure to the property sector.
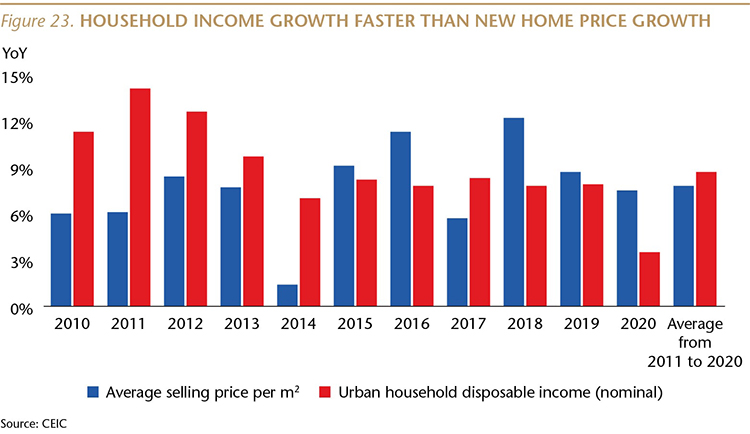
Sharp increases in home prices have been limited to a small number of cities, and overall, prices have risen in line with income. Over the ten years thought 2019, prior to the pandemic, new home prices rose at an average annual pace of 7.7%, while nominal urban income rose at an average rate of 9.5%. In 2020, new home prices rose 7.5% while nominal urban income rose 3.5%.
China does face a serious property problem, but it is a social and political problem. In larger cities, many residents are priced out of the market and may never be able to afford to own a home. This problem— shared by cities such as San Francisco, New York and London—is a long-term challenge, and it’s one with consequences that are very different from a housing bubble.
Renewed Regulatory Scrutiny of Tech and Fintech Firms
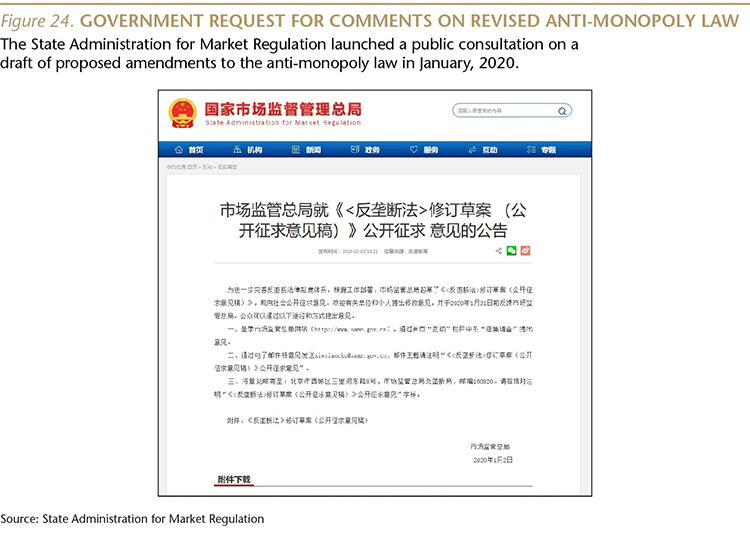
China’s technology, internet and fintech companies have faced renewed regulatory scrutiny. As in many countries, regulators in China are thinking more about consumer protection, data security and anti-trust issues related to their country’s tech sector. While we do not believe new regulations will result in dramatic changes to the corporate tech landscape in China, we are monitoring developments to help us understand potential impacts on business models and valuations of companies held by our strategies.
While it appears some Chinese entrepreneurs are being singled out for greater attention, we believe the government’s intention is to limit the political activities of those individuals, rather than to interfere in their commercial activities. We do not believe the government’s aim is to break up the larger Chinese internet companies. These are some of China’s most innovative companies, and the government’s economic growth plans are based on innovation.
Government Support for Private Enterprise
In our view, there is no evidence that the government has become less supportive of privately owned companies.
It is clear that private firms are the engine of China’s growth and job creation. Almost 90% of urban employment is in private companies, and private firms also account for the majority of China’s exports.
Privately owned companies are China’s most innovative firms, and the government’s economic growth plans are based on innovation.
We also note that the two largest, publicly listed Chinese companies, by market cap, are privately owned. Privately owned firms also account for about 80% of companies listed on China’s science and technology board, its version of NASDAQ.
As noted earlier, with private firms driving job creation and innovation in China, they are the focus of my investment team colleagues at Matthews Asia. Among the top 10 holdings of our China Strategy, as of the end of 2020, only two were state-owned (both financials), and among the top 10 holdings of our China Small Companies Strategy, none were state-owned. Among the top 10 holdings of our China Dividend Strategy, four were state-owned, as of the end of 2020.
In the financial sector, I believe the government is encouraging limited competition. In January, a senior Chinese financial sector regulator stated that “the private economy is an indispensable driving force of our country.” He added that, “financial regulatory authorities have always supported the development of the private economy.”
The regulator noted that “internet platform companies such as Ant Group . . . have played an innovative role in developing financial technology, and improving the efficiency and inclusiveness of financial services.”
Can We Trust China’s Macro Numbers?
This issue of Sinology has served up numerous data about the Chinese economy, and I’m sure some of you are wondering, “can we trust those numbers?”
Some official Chinese data is fairly useless. The “urban registered unemployment rate,” for example, rarely changes. Even during the height of China’s COVID-19 outbreak in 2Q20, that rate only rose to 3.84%, from 3.61% a year earlier. But, the problem with this data isn’t political, it’s the result of poor methodology, and for many years, government officials I’ve spoken with have been quick to acknowledge the uselessness of this statistic. There is, however, a wide range of economic data that has proven to be far more useful in helping investors understand broad trends, despite concerns about the exact numbers.
Let’s dig deeper into data on the Chinese consumer, since consumption is the largest part of the economy, drives most of the growth, and is a favorite sector for investors.
Some observers have expressed skepticism about the accuracy of the consumer numbers we provided earlier in this paper. Can retail spending in China really have gone from 46% of U.S. retail sales to 92% over the last ten years before the global pandemic? Can inflation-adjusted income have risen over four times faster in China compared to the U.S. over that period? Our macro due diligence includes two methods for verifying those trends. First, we speak often with small, privately owned but not publicly-traded Chinese companies, to check their reports against the official numbers.
Second, we compare reports from publicly traded, foreign owned companies against the official data. For example, Nike reported double-digit revenue growth in Greater China for 22 consecutive quarters prior to the COVID outbreak. After a three-quarter pause due to the pandemic, double-digit growth resumed in the company’s quarter ending in November, 2020. Apple reported its highest-ever revenue in China, during its quarter ending in December, 2020.
Similarly, in 2020, GM again sold more cars in China than in the U.S.
Of course, these macro channel checks do not allow us to confirm that the officially reported real retail sales growth rate of 5.2% YoY in the fourth quarter of last year was precisely accurate, but they do give us confidence in the basic trends, and in our view that China is the world’s best consumer story.
Wrapping up
We will close by returning to the question we raised at the opening of this issue of Sinology: China drives global economic growth. Do you have adequate exposure to China in your portfolio?
To repeat our key message: In the 10 years through 2019, on average, China accounted for about one-third of global economic growth, larger than the combined share of global growth from the U.S., Europe and Japan.
We hope this report has answered some of your questions about China.
We also hope this report has raised more questions, and we’d be delighted to be your resource for China macro and investment strategy questions.
Andy Rothman
Investment Strategist
Matthews Asia
Back to Thought Leadership